

103.3. Join tables with ADQL#
For the Portal Aspect of the Rubin Science Platform at data.lsst.cloud.
Data Release: Data Preview 2
Last verified to run: 2026-08-14
Learning objective: Join multiple tables to retrieve combined results with ADQL.
LSST data products: Source, Visit, VisitDetector and Object tables
Credit: Originally developed by the Rubin Community Science team. Please consider acknowledging them if this tutorial is used for the preparation of journal articles, software releases, or other tutorials. DOI: 10.11578/rubin/dc.20250909.20
Get Support: Everyone is encouraged to ask questions or raise issues in the Support Category of the Rubin Community Forum. Rubin staff will respond to all questions posted there.
Warning! Not all tables can be joined. Two tables must have a column in common to be joined.
1. Go to the DP1 & DP2 Catalogs ADQL interface. Navigate to the Portal’s DP1 & DP2 Catalogs tab and switch to the ADQL interface by clicking “Edit ADQL”.
2. The ADQL components of a JOIN…ON statment. The generic example below illustrates a common join scenario. Four columns (“ra”, “dec”, “colA”, and “colB”) are selected from “table1”, for objects where their coordinates are within 0.05 degrees of RA=62 deg, Dec=-37 deg. The results from “table1” are joined with “table2” on their matching column, “colID”. Two columns are selected from “table2” (“colX” and “colY”).
**This is a generic example - it cannot be executed.**

SELECT tab1.ra, tab1.dec, tab1.colA, tab1.colB, tab2.colX, tab2.colY
FROM table1 AS tab1
JOIN table2 AS tab2
ON tab1.colID = tab2.colID
WHERE CONTAINS(POINT('ICRS', tab1.ra, tab1.dec),
      CIRCLE('ICRS', 62.0, -37, 0.05)) = 1
3. Execute a two-table join.
The Source table (detections in individual processed visit images) can be joined with the
VisitDetector table (metadata about individual visits) using a shared column, named visit
in the Source table and visitId in the VisitDetector table, which identifies an LSST visit.
Constraints can be applied on columns from either or both tables.
Spatial constraints are applied to the FROM table, not the JOIN table.
SELECT src.ra, src.dec, src.sourceId, src.band,
       scisql_nanojanskyToAbMag(src.psfFlux) AS psfAbMag,
       src.visit, vd.visitId, vd.expMidptMJD
FROM dp2.Source AS src
JOIN dp2.VisitDetector AS vd
ON src.visit = vd.visitId
WHERE CONTAINS(POINT('ICRS', src.ra, src.dec),
      CIRCLE('ICRS', 53.13, -28.10, 0.05)) = 1
      AND vd.expMidptMJD > 60800 AND vd.expMidptMJD < 61050
      AND src.band = 'i'
4. Review the two-table join results.
Notice that this join is not one-to-one: there are multiple individual sources returned that are matched to the same visit.
In other words, there are multiple rows from the Source table joined with a given row from the VisitDetector table.
If multiple tabs are present above the upper left panel in the default Results tab layout, click the “Coverage” tab to display the coverage chart.
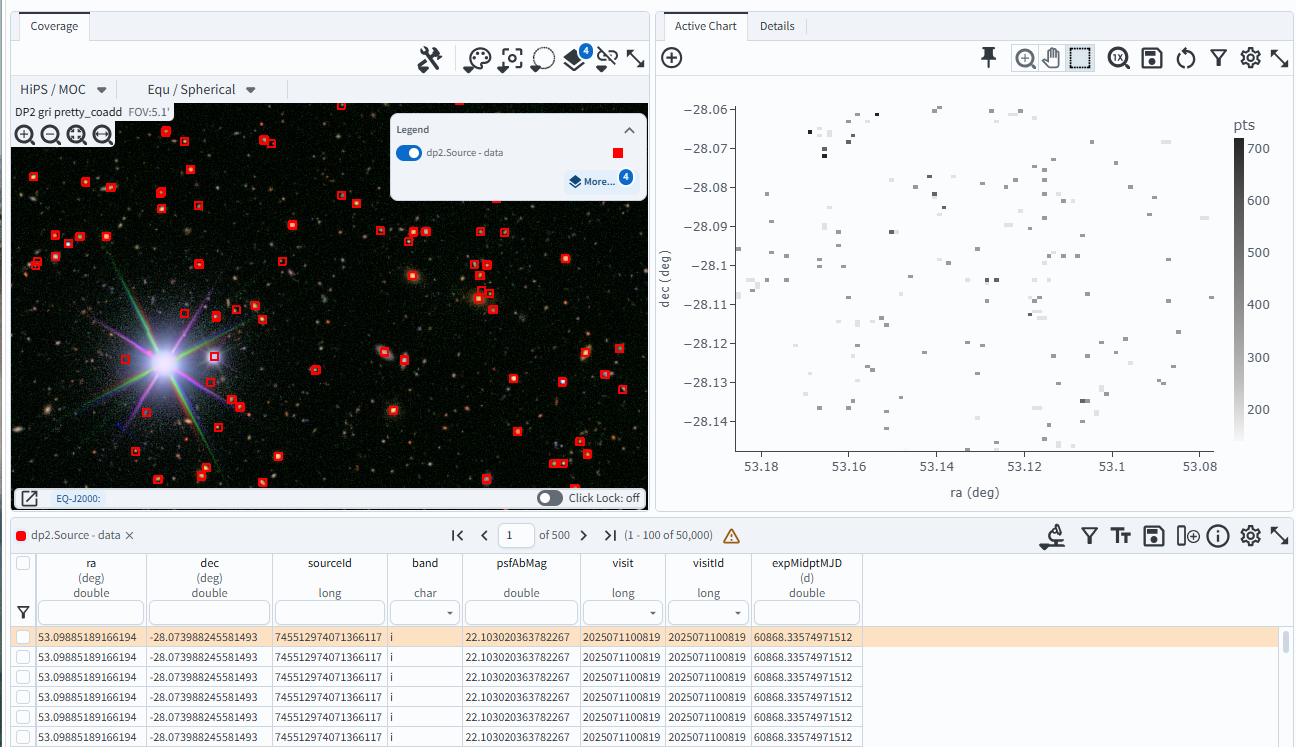
Figure 1: The Portal Results tab with a default layout for the data returned from the two-table join query.#
5. Execute a three-table join.
The Object table (photometry in the deepCoadd images) can be joined with the ForcedSource table (photometry in individual visit images) using their shared objectId column.
The ForcedSource table can be joined with the Visit table (metadata about individual visits) using a shared column, named visit
in the ForcedSource table and visitId in the Visit table, which identifies an LSST visit.
SELECT obj.coord_ra, obj.coord_dec, obj.objectId, obj.refExtendedness, obj.i_psfMag,
       scisql_nanojanskyToAbMag(fs.psfFlux) AS fs_psfAbMag,
       v.visit, v.expMidptMJD
FROM dp2.Object AS obj
JOIN dp2.ForcedSource AS fs ON obj.objectId = fs.objectId
JOIN dp2.Visit AS v ON fs.visit = v.visit
WHERE CONTAINS(POINT('ICRS', obj.coord_ra, obj.coord_dec), CIRCLE('ICRS', 53.13, -28.10, 0.05)) = 1
      AND obj.i_sizeExtendedness < 0.5 AND obj.i_psfMag < 23
      AND fs.band = 'i' AND v.expMidptMJD > 60800 AND v.expMidptMJD < 61050
6. Review the three-table join results.
The join of Object to ForcedSource is one-to-many, and the join of ForcedSource to Visit is many-to-one.
To view the coverage chart, click the “Coverage” tab at the top of the upper left panel.
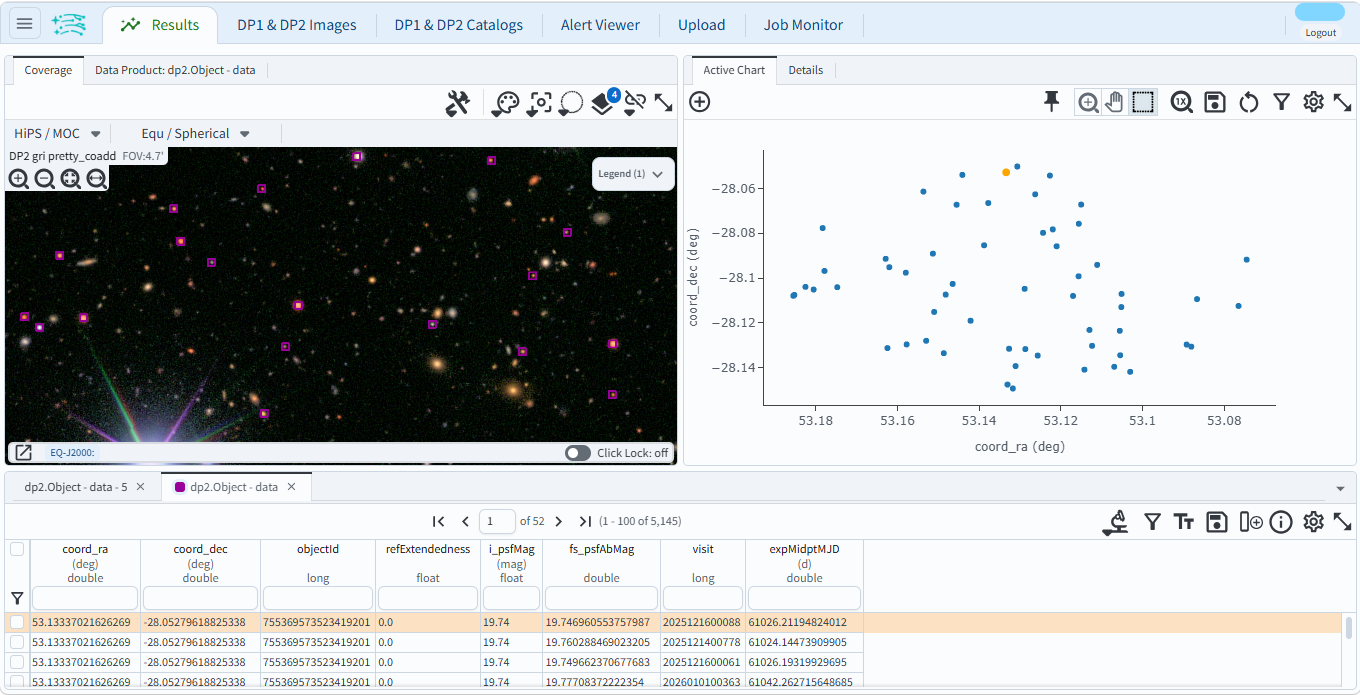
Figure 2: The Portal Results tab with the layout displaying the activated coverage chart for the data returned from the three-table join query.#