

103.5. Convert flux to magnitude with ADQL#
For the Portal Aspect of the Rubin Science Platform at data.lsst.cloud.
Data Release: Data Preview 2
Last verified to run: 2026-08-14
Learning objective: Convert fluxes to magnitudes using a special ADQL function.
LSST data products: Object table
Credit: Originally developed by the Rubin Community Science team. Please consider acknowledging them if this tutorial is used for the preparation of journal articles, software releases, or other tutorials. DOI: 10.11578/rubin/dc.20250909.20
Get Support: Everyone is encouraged to ask questions or raise issues in the Support Category of the Rubin Community Forum. Rubin staff will respond to all questions posted there.
Magnitude conversions#
While the Object table includes magnitudes (e.g., PSF and cModel), many other photometry measurements are provided only as fluxes (in nJy).
These fluxes can be converted to AB magnitudes using the scisql_nanojanskyToAbMag() function, which applies the equation \(m = -2.5 log_{10}(f) + 31.4\),
where \(m\) is magnitude and \(f\) is flux.
Warning! Fluxes measured in difference images can be negative.
The scisql_nanojanskyToAbMag() function should be used only with positive flux values.
1. Go to the DP1 & DP2 Catalogs ADQL interface. Click on “DP1 & DP2 Catalogs”, then click on “Edit ADQL” in the upper right corner.
2. Set up a query that returns magnitudes.
The following query returns the r-band cModel and Sersic-flux derived magnitudes, and their errors, for objects brighter than 25th magnitude in r-band.
It demonstrates the use of AS to name computed columns and applies a spatial constraint selecting objects within a 0.2-degree radius near the center of the ECDFS field.
SELECT r_cModelMag,
       scisql_nanojanskyToAbMag(r_sersicFlux) AS r_sersicMag,
       r_cModelMagErr,
       scisql_nanojanskyToAbMagSigma(r_sersicFlux, r_sersicFluxErr) AS r_sersicMagErr
FROM dp2.Object
WHERE CONTAINS(POINT('ICRS', coord_ra, coord_dec),
      CIRCLE('ICRS', 53.13, -28.1, 0.2))=1
AND r_cModelMag < 25
AND scisql_nanojanskyToAbMag(r_sersicFlux) < 25
3. View the results. Figure 1 shows the results interface, with the table containing only magnitudes and the default plot using the first two columns.
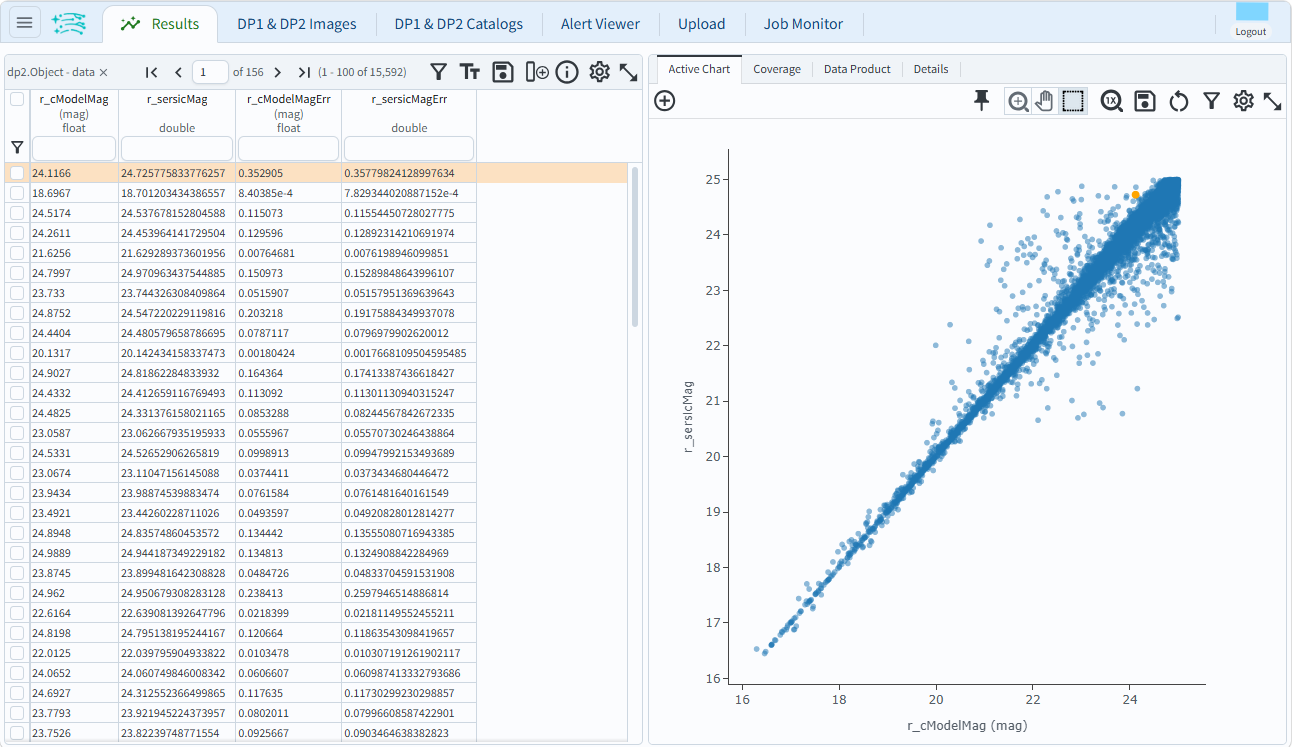
Figure 1: The table panel in the results interface shows no flux columns, but magnitude and magnitude error columns.#